-
-
Insert LOGIN and PASSWORD
-
-
-
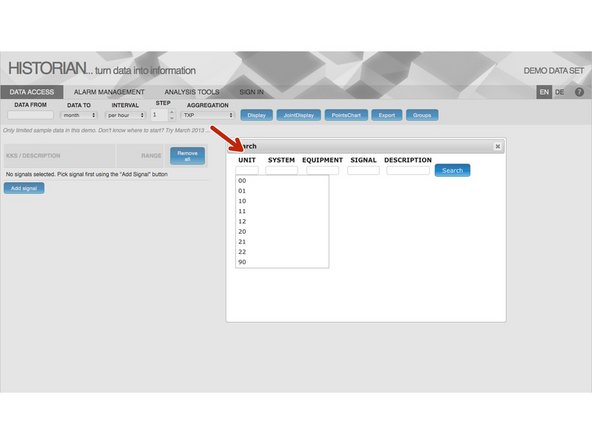
To search for signal data, click Add signals button
-
-
-
Select the type of signal you want to search for.
-
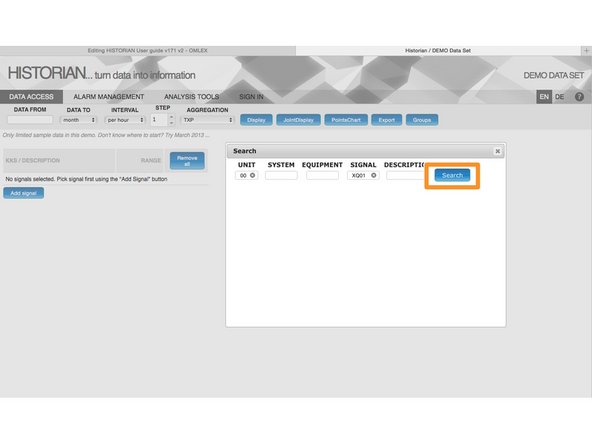
Select SEARCH
-
-
-
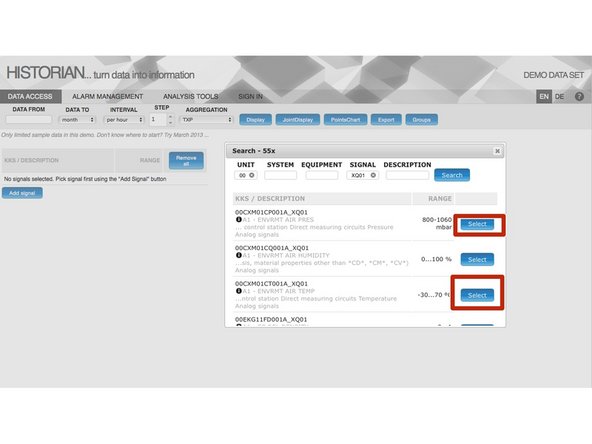
Once you have the signal, you can choose the ones you want by clicking on SELECT
-
You can select the signals that remain.
-
-
-
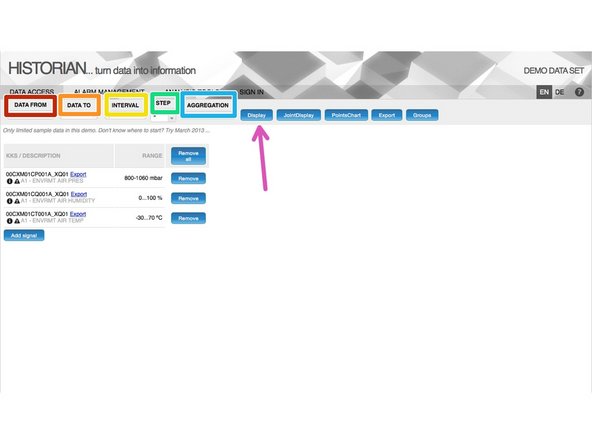
After finding requested signals the users should specify the point of view they are requesting.
-
DATA FROM – start of the requested data range
-
DATA TO – end of the requested data range. May be specified either relatively (day, week, month, quarter, half-year, year, two years or ten years) or absolutely (value custom)
-
INTERVAL – represents the aggregation interval (one value per second/minute/hour/day) or raw data
-
STEP – aggregation step (usually 1 which means one value per one hour, etc.)
-
AGGREGATION – aggregation method (OPC aggregation method such as Interpolative, Average, etc.) or TXP aggregation which should correspond to the aggregation method of the original system
-
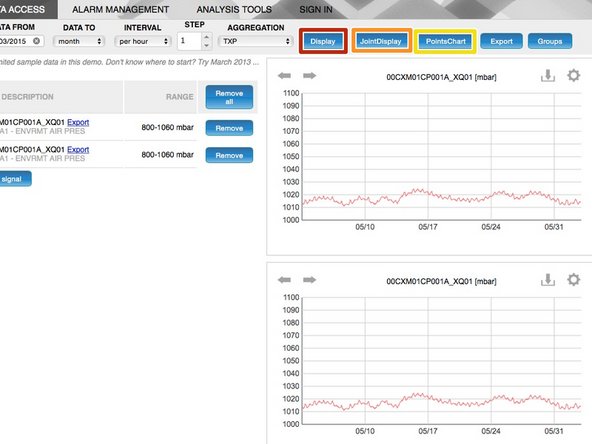
Cuando estén todos los datos, haremos click en DISPLAY
-
-
-
Once the point of view is specified, users may show charts with signal values.
-
Display – shows separate chart for each signal
-
JointDisplay – show one chart containing all selected signals as separate series
-
PointsChart – available only if exactly two signals are selected – the values of signals are used as axis points.
-
-
-
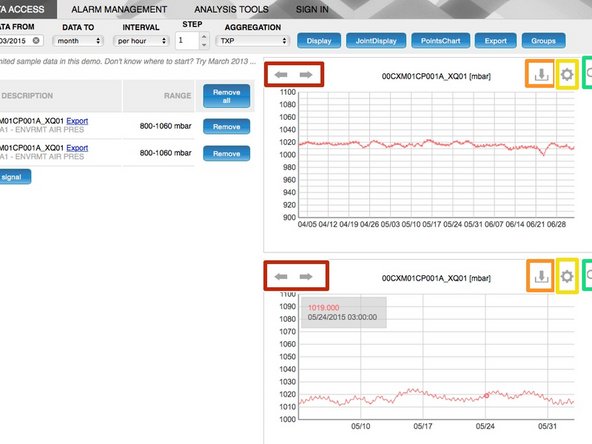
Charts allow additional user interactions – user may:
-
Browse through the previous/following time intervals using the left/right arrows
-
Download chart as a PNG image
-
Configure various aspects of the chart (series colors, axis) or zoom time range series using quick sliders
-
Zoom chart to the whole screen
-
-
-
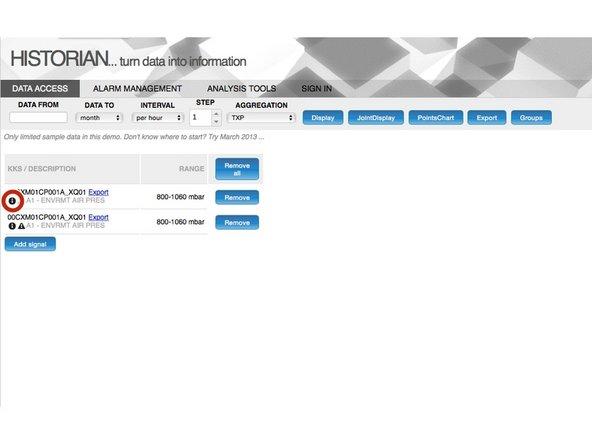
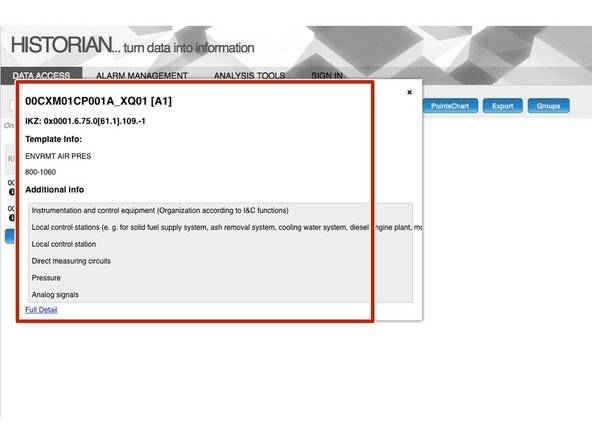
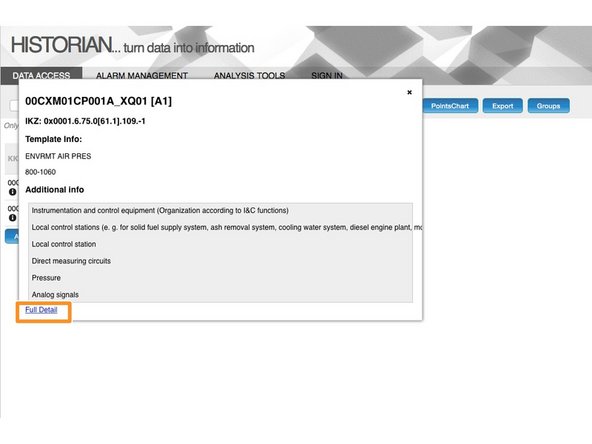
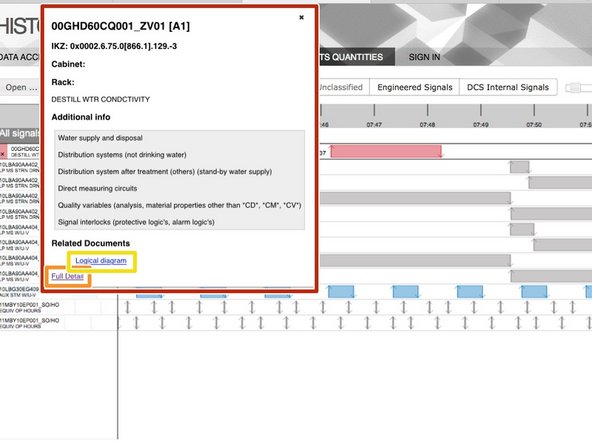
There is a small icon next to the KKS sign that shows information in small
-
-
-
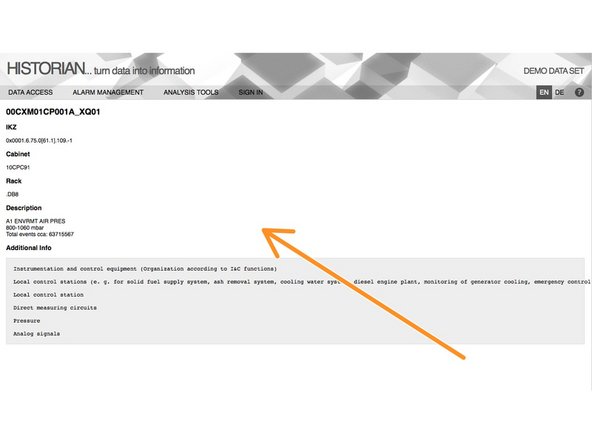
Also shows full detail of the signal
-
-
-
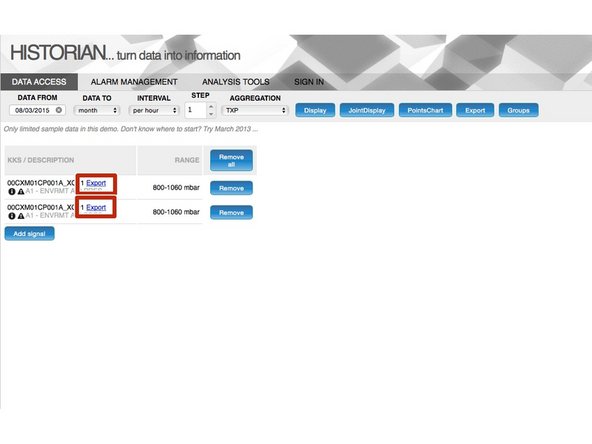
Signal data may be exported either for one signal or for all signals at once.
-
Click Export
-
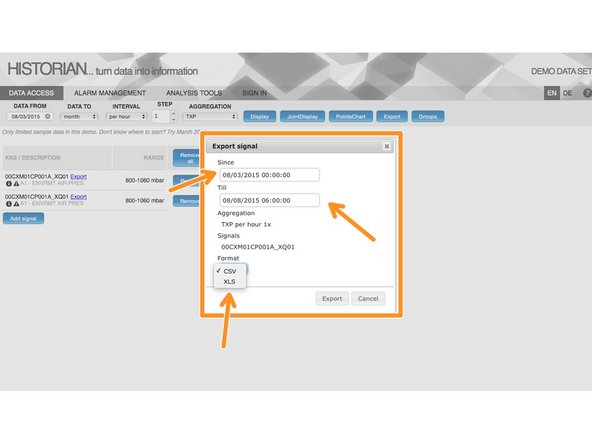
Exact time can be specified in the Export dialog (using hour, minutes and seconds) as well as export format (CSV or XLS).
-
Joint export is not available for exporting raw data (as there is no way to pair particular values)
-
-
-
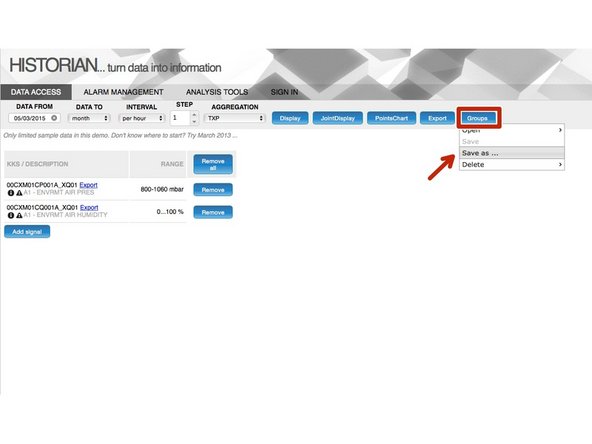
Users can save the list of frequently used signals in the so-called Group and can be private or public
-
Select GROUPS and SAVE AS
-
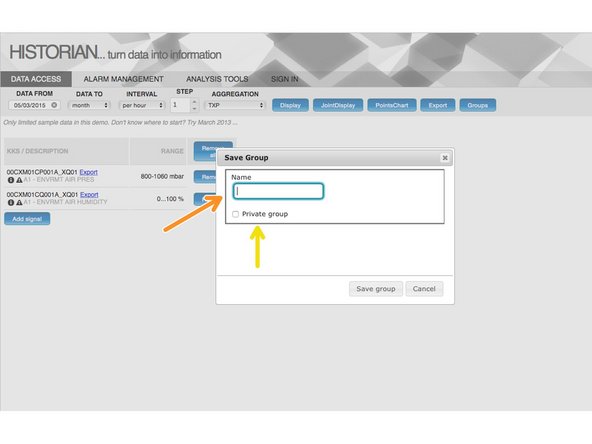
Enter group name
-
Select private or not
-
Once the group is saved, user may get back to the list at any time by simply opening the group.
-
-
-
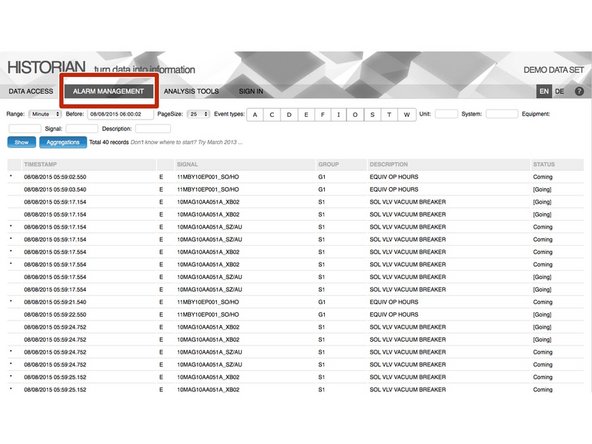
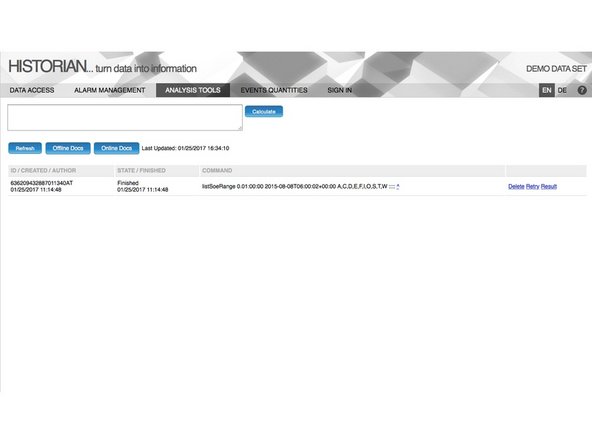
Alarm management serves as a browser page for Sequence of Events (SOE) data.
-
Select ALARM MANAGEMENT
-
-
-
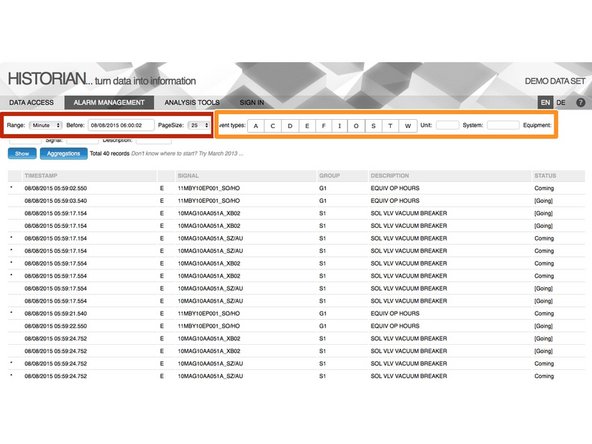
The range can be specified either relatively (as a minute/hour/day/week before a timestamp) or absolutely (using custom range between two timestamps).
-
The events can be filtered using their event types or by the properties of corresponding signals (eg. Unit/System/Equipment/Signal/Description).
-
-
-
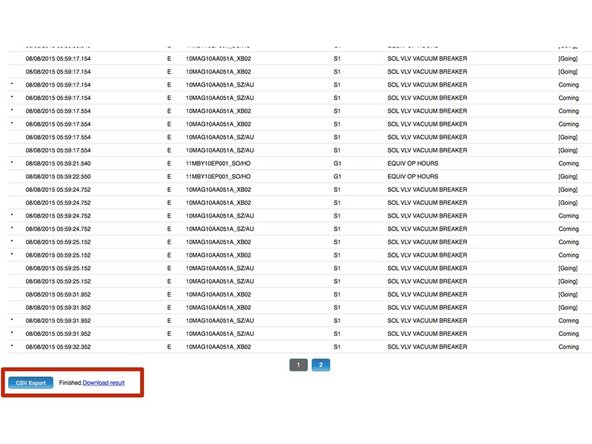
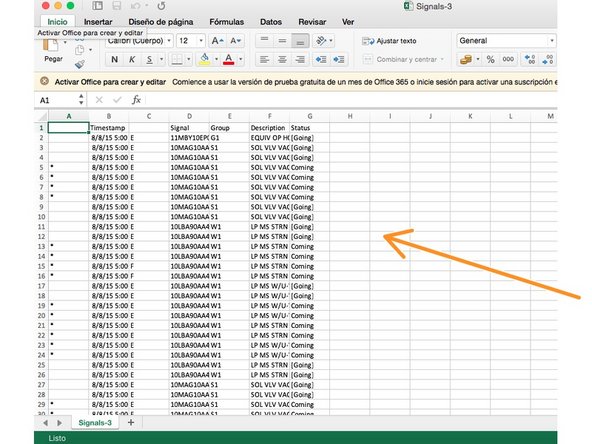
Selected events can be exported into a CSV file by pressing the Export button at the bottom of the page.
-
CSV exported
-
-
-
????
-
-
-
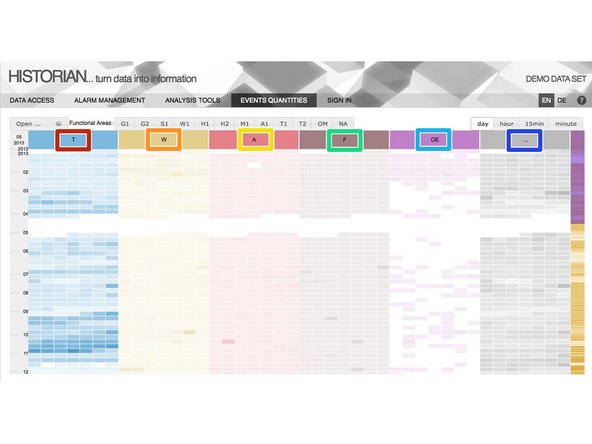
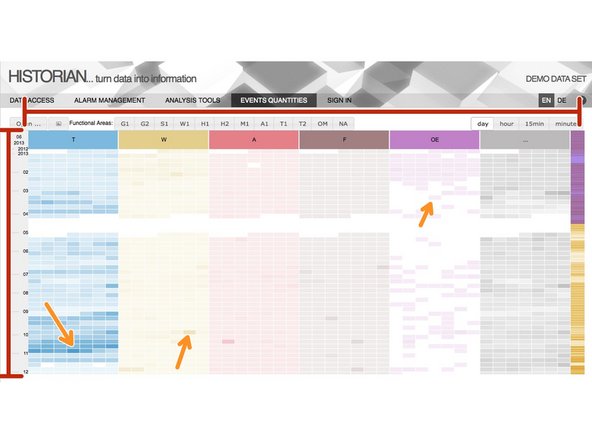
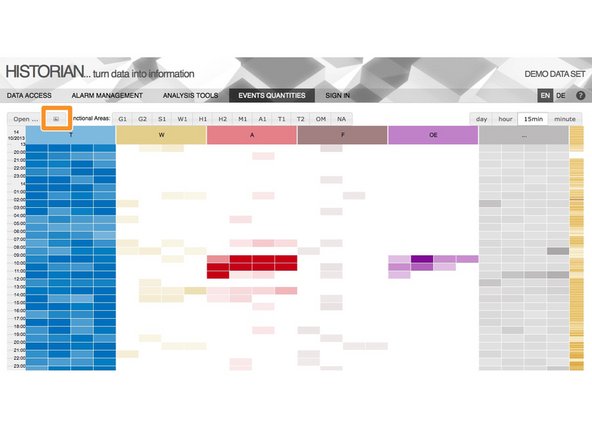
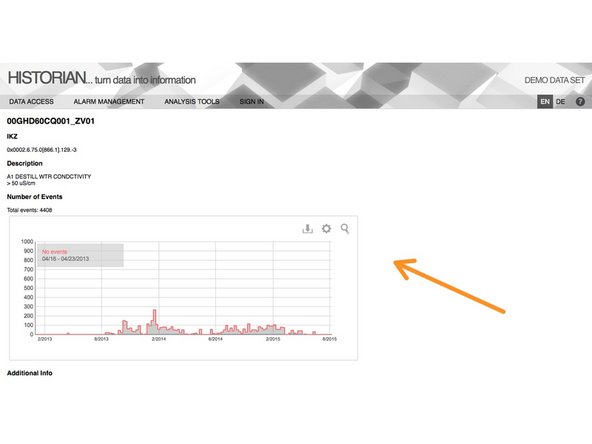
Events quantities provides a quick overview of the complete dataset. The overview represents separate columns for each event types.
-
W for warnings
-
T for tolerances
-
A for alarms
-
F for failures
-
OE for operator events
-
... for summary of other types of events
-
-
-
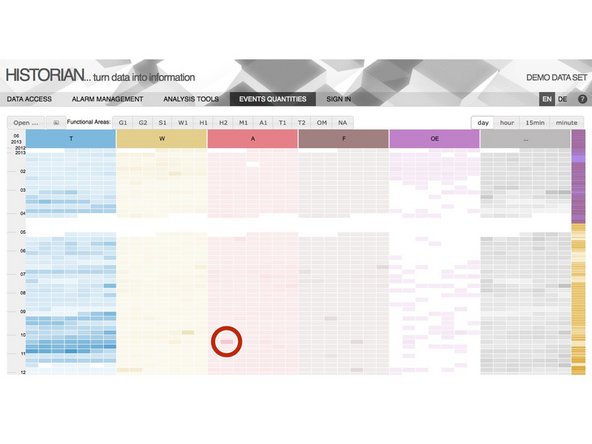
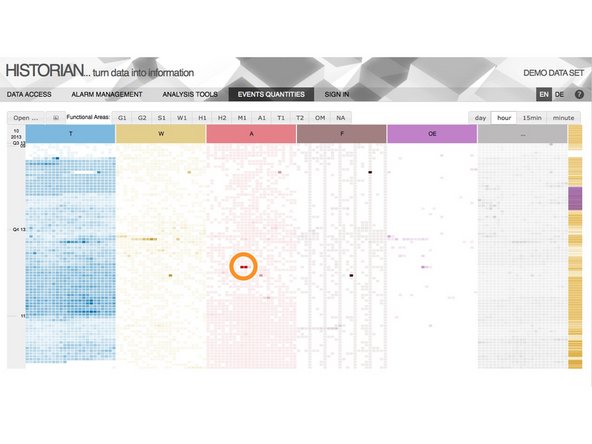
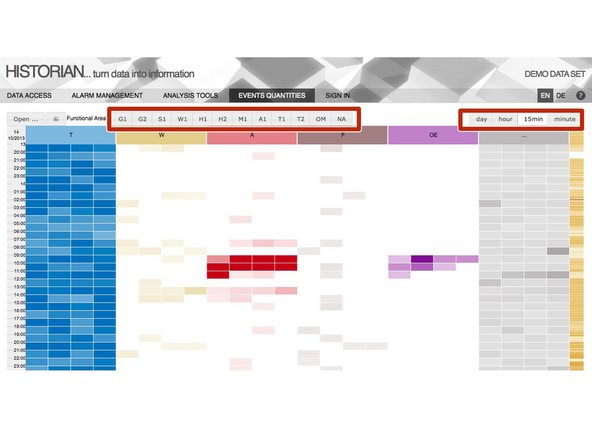
Each cell represents a particular time period (day/hour/15min/minute).
-
Particular value can be shown by hovering a mouse cursor over the cell.
-
Intensity of the color represents the number of events in particular cell
-
-
-
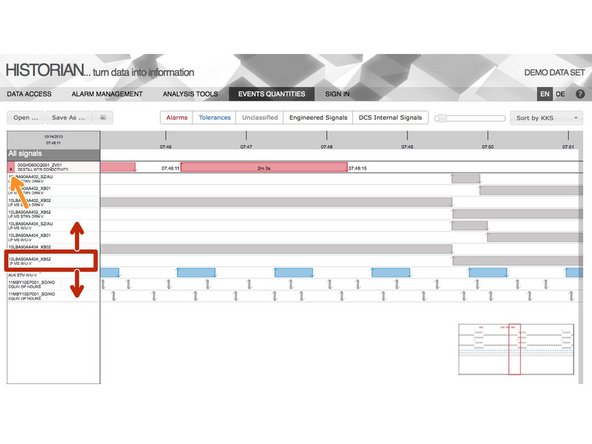
By clicking a cell, particular time range is selected and a detailed view is displayed.
-
More detail
-
More detail
-
-
-
The view can be filtered with respect to any functional area or their combination.
-
For reporting purposes, the view can be also saved as a PNG file using the button with image icon.
-
-
-
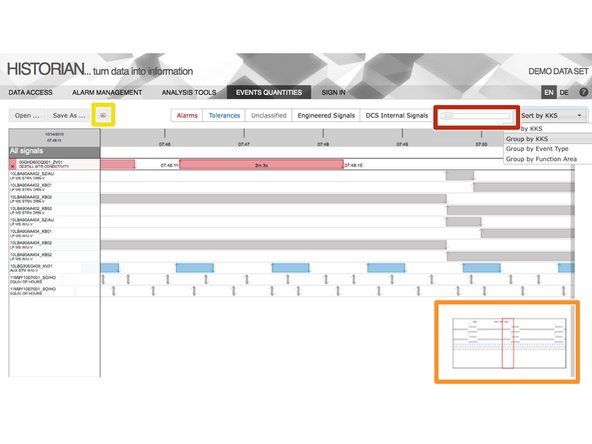
Detailed view allows users to precisely analyze the events inside the system, their exact timing, sequences and durations. Each row in this view represents a particular signals which appeared during the selected time range.
-
Signals can be reordered (by simple drag and drop on their label)
-
Hidden (by pressing the X mark next to the label of selected signal)
-
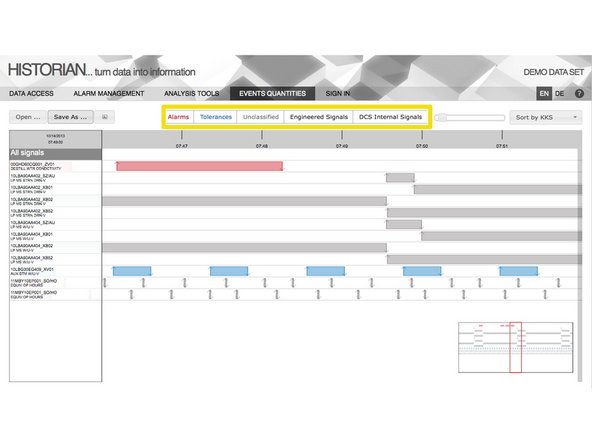
The whole list can be filtered by their type (typically for Alarms, Warnings, Failures, Tolerances, Operator Events) or by their nature (Engineered Signals or DCS Internal Signals)
-
-
-
To have more information click
-
Full detail
-
Logical Diagram
-
-
-
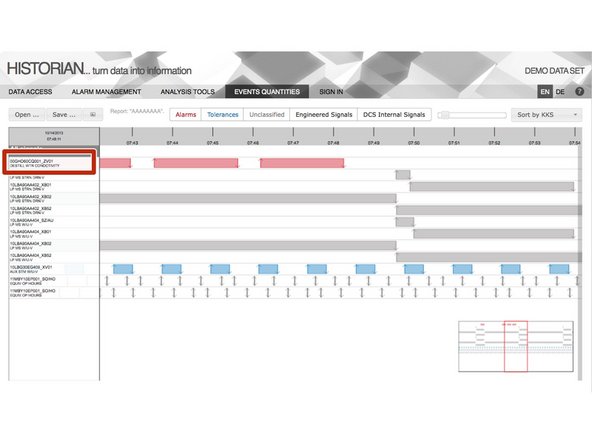
The view can be zoomed (by dragging the zoom slider on the right top part of the page) or sorted.
-
Right bottom part of the page contains a quick preview of the selected time range with all signals at once (to quickly spot important timestamps).
-
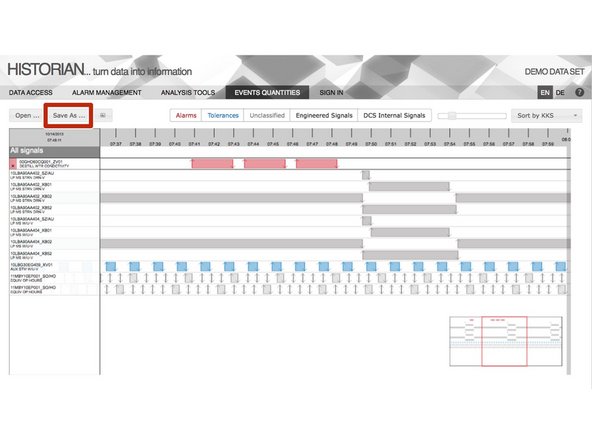
Detailed view can be saved into a PNG picture by pressing the button with image icon.
-
-
-
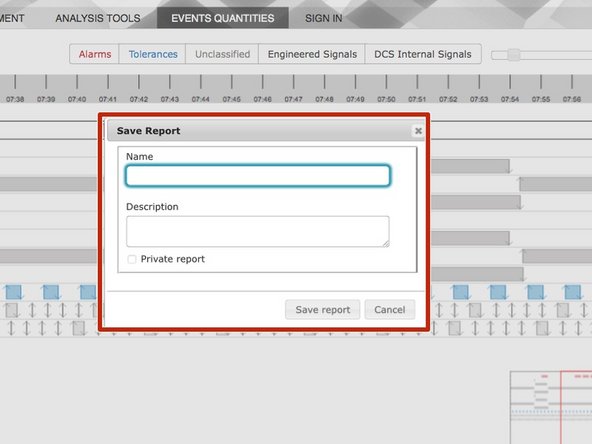
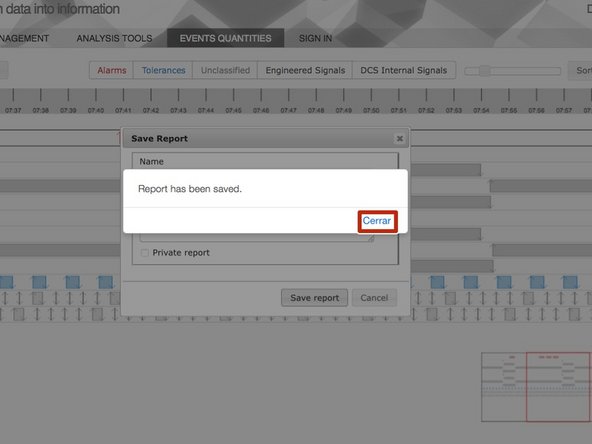
Current state of the page can be saved at any time using so-called Reports.
-
Reports are created using the button Save as... and can be either public (all users can see them) or private (only for its creator).
-
-
-
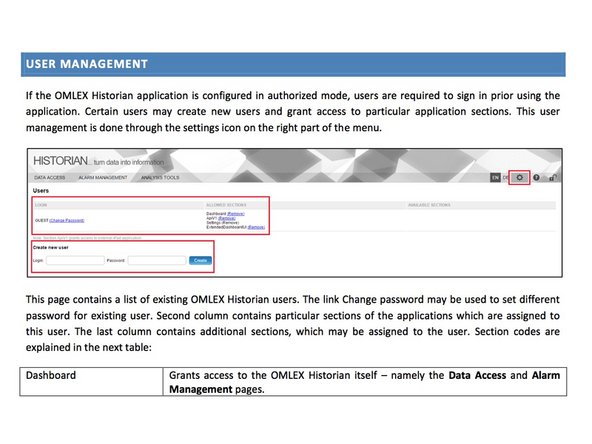
If the OMLEX Historian application is configured in authorized mode, users are required to sign in prior using the application.
-
This user management is done through the settings icon on the right part of the menu.
-